Sound Tuning at College's Rooms
Kolej Komuniti Room Acoustics Measurement
In the event of complete installed of a professional sound system, the final step will be testing and commissioning. Testing involves ensuring whole system run smoothly and commissioning includes sound tuning and report submitting.replica hermes handbags
Room Acoustic Measurement Methodology
- Set up the hardware shown in Figure 1.

Figure 1: Block Diagram of Room Measurement Setup
- Use Smaartlive software in computer to generate pink noise. This will send the pink noise to interface. From interface, it will send pink noise back to the computer and to Kolej Komuniti’s sound system.
- Pink noise will play from the sound system and measured by microphone.
- Measured pink noise is send back to computer through the interface.replica louis vuitton
Technical Terms
Pink Noise
Pink noise is a type of signal that contains all of the sound frequencies that fall within the range of a human being’s hearing — from the lowest pitches that a person can hear to the highest tones. In pink noise, each octave carries an equal amount of noise power.
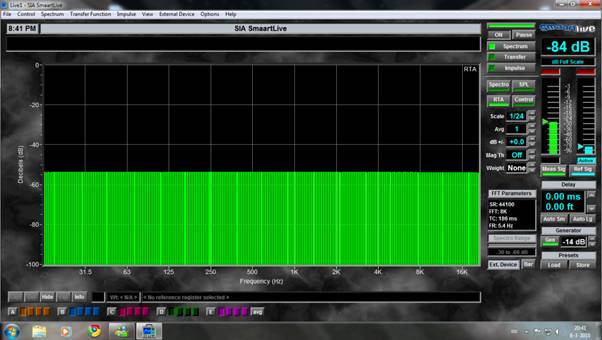
Figure 2: Pink Noise
Measurement
Each spot within the room will be produced with 5 acoustic measurements; Frequency Spectrum, Frequency Transfer Function (deciBel), Frequency Transfer Function (phase), Frequency Spectro and SPL.
Frequency Spectrum
The RTAs display in Frequency Spectrum, allows you to see the amount of energy present in various frequency ranges, typically fractional octave bands, across the audible spectrum. The RTA plot puts magnitude on the (vertical) y-axis and frequency on the (horizontal) x-axis.
Frequency Transfer Function (decibel)
A transfer function is a mathematical comparison of complex FFT data from two signals — typically the input and output of a device or system. SmaartLive uses this calculation to find how one signal differs from the other. In Kolej Komuniti case, original pink noise and measured pink noise is compared.
Frequency Transfer Function (phase)
Phase display in Transfer Function mode shows the phase shift, or time difference in the measurement signal relative to the reference signal frequency by frequency.
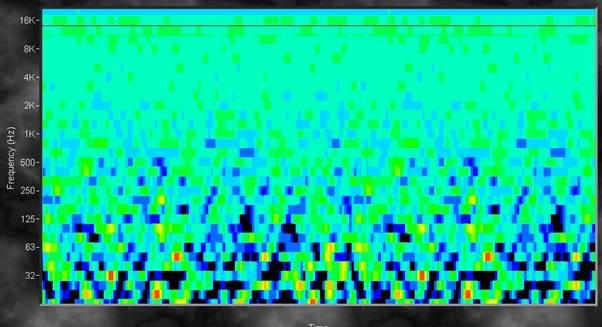
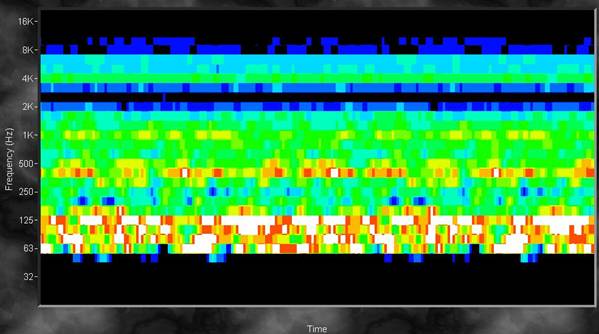
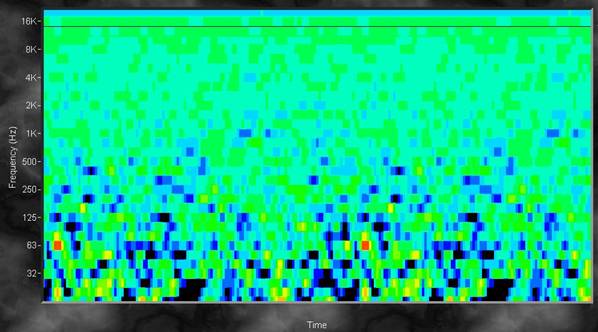
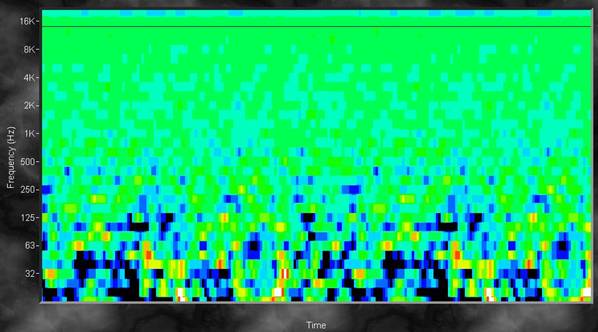
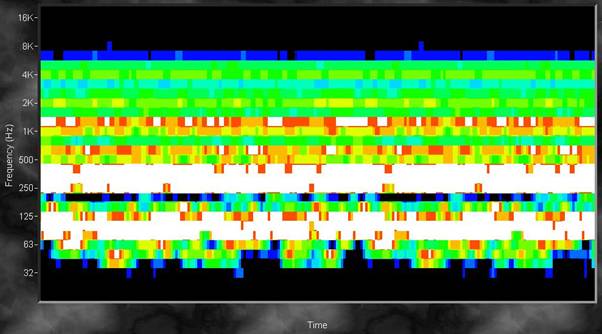
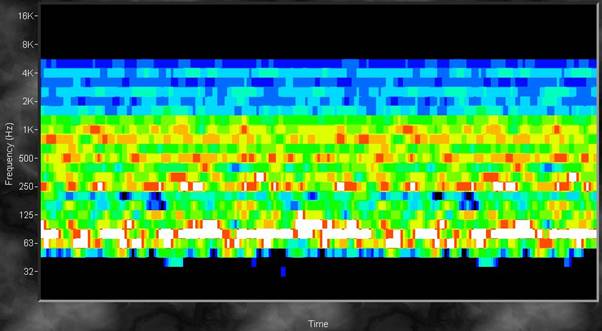
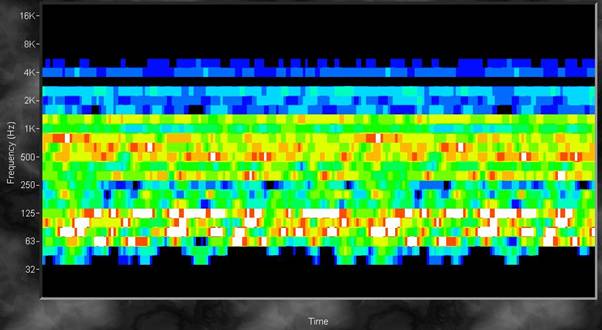
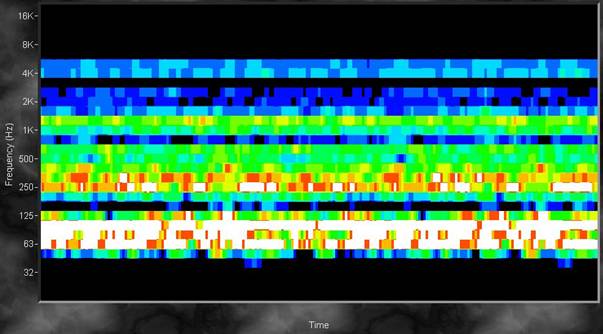
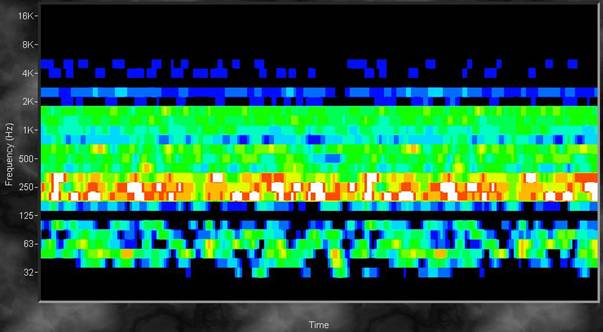
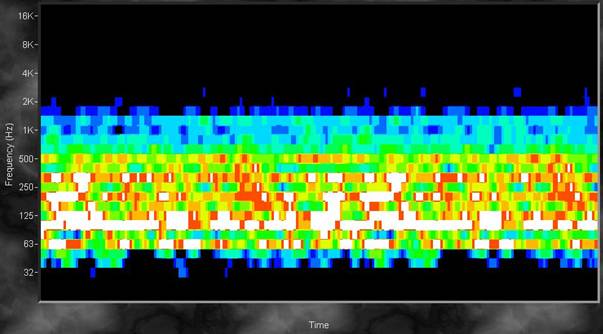
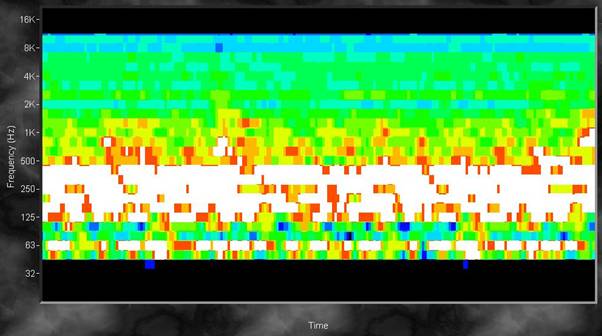
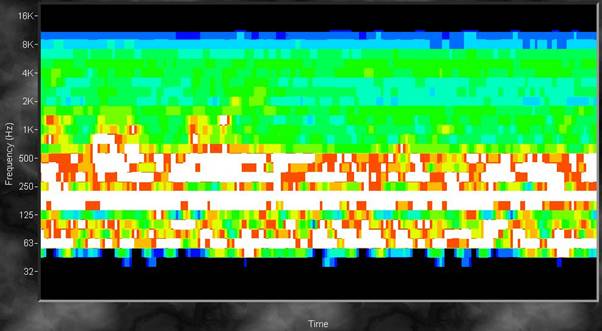
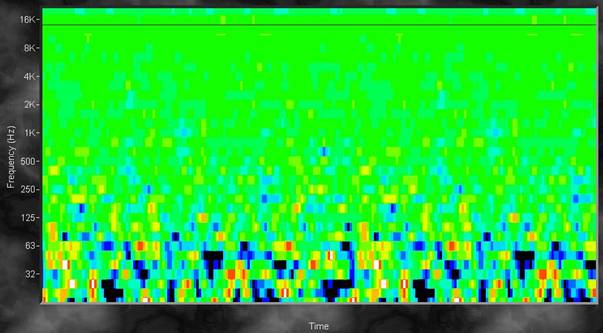
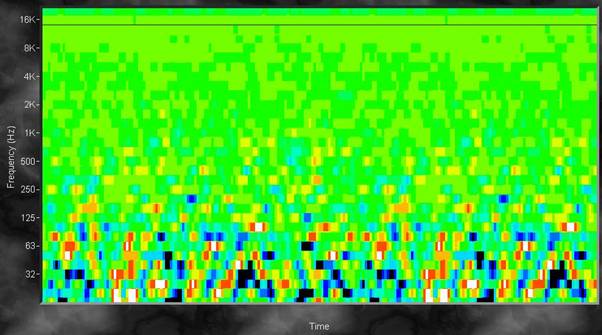
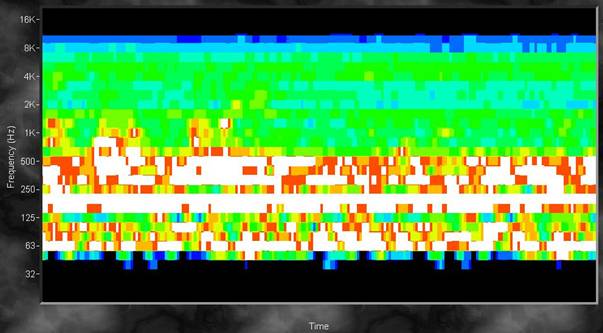
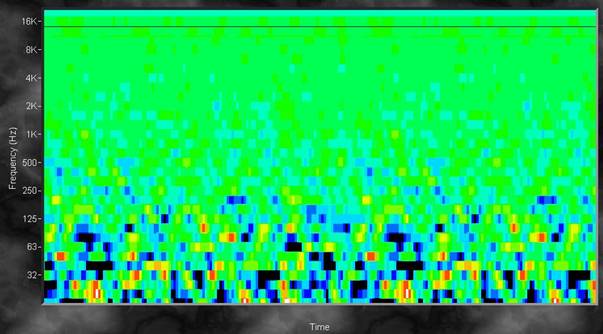
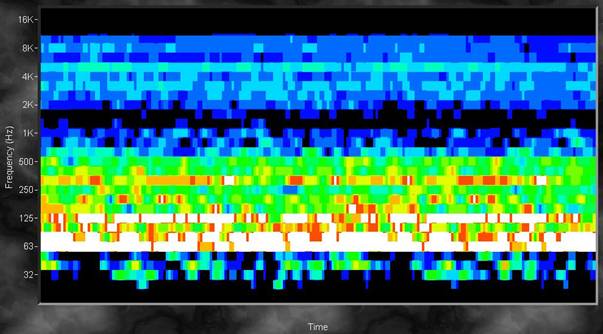
Spectrograph
Spectrograph, is a way of looking at changes in RTA data over some period of time. The Spectrograph display plots time (in FFT frames) on the x-axis and frequency on the y-axis with amplitude represented by color. Spectrograph display is in terms of a common real-time spectrum analyzer RTA). On a typical RTA display, magnitude values for each fractional octave frequency band are indicated by vertical bars of varying height. If, instead of rising to a different height, each frequency band (or individual FFT bin) changed color to indicate higher or lower magnitude, you would end up with a horizontal line made up of different colored segments that showed the spectrum of a signal at a given moment. If you then rotated that line 90°, you would have one vertical slice of a Spectrograph display. Stack a number of these slices side by side and you would have a plot that shows you how the spectrum of the input signal changed over some period of time. The Spectrograph display effectively shows you three dimensional data (time, frequency and energy) on a two dimensional plot with time on the x axis, frequency on the y axis and magnitude represented by color.
SPL
SPL History display which allows you to look at changes in broadband signal level or Sound Pressure Level (SPL) over some period of time. SPL is a broadband measurement encompassing all audible frequencies.
Room 1
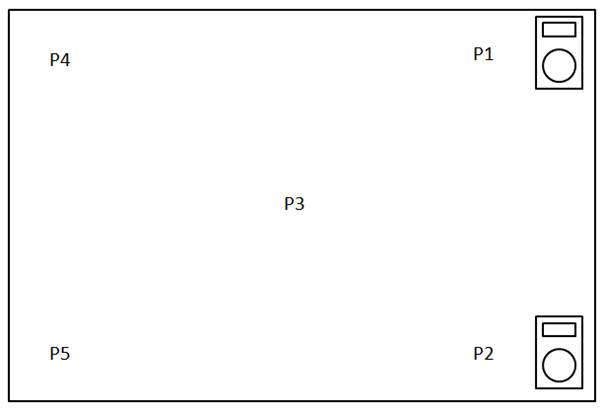
Figure 3: Room 1 Layout & Measurement Points
Point P1

Figure 4: Room 1 Point P1 Frequency Spectrum
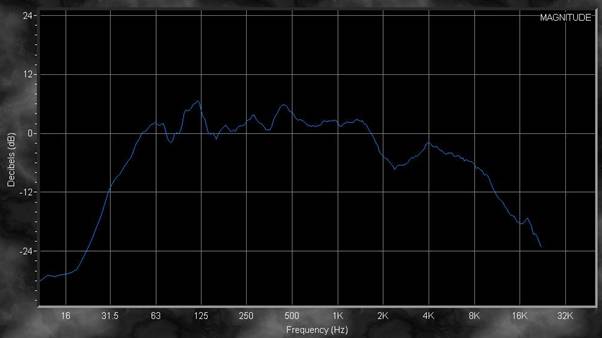
Figure 5: Room 1 Point P1 Frequency Transfer Function (decibel)
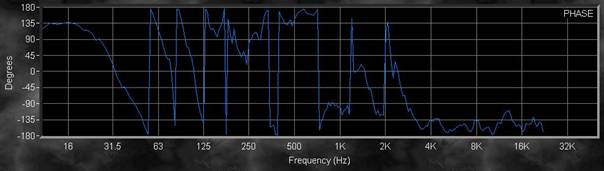
Figure 6: Room 1 Point P1 Frequency Transfer Function (Phase)
![]()
Figure 7: Room 1 Point P1 Spectrograph
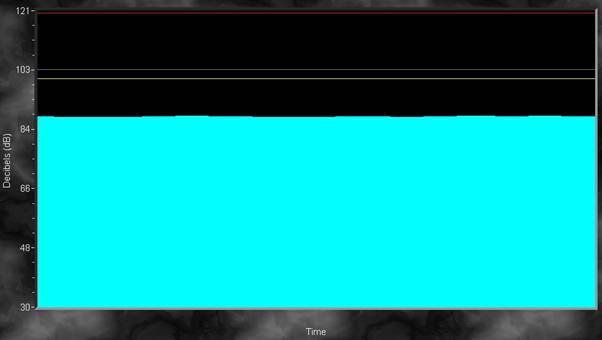
Figure 8: Room 1 Point P1 SPL
Point P2
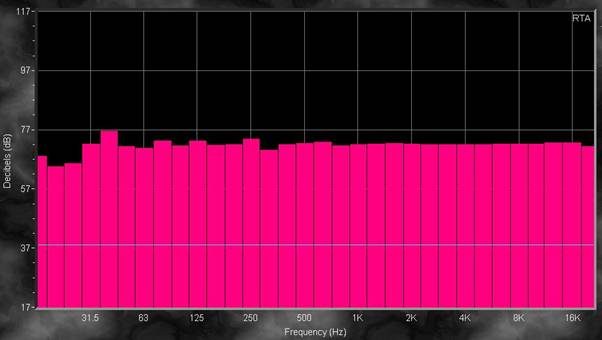
Figure 9: Room 1 Point P2 Frequency Spectrum
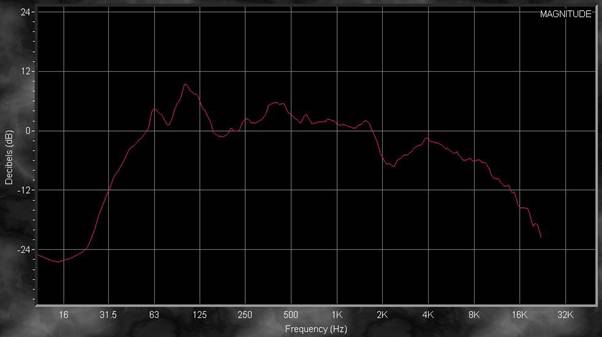
Figure 10: Room 1 Point P2 Frequency Transfer Function (decibel)
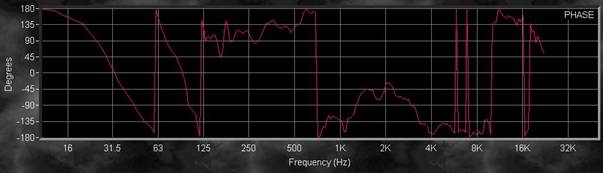
Figure 11: Room 1 Point P2 Frequency Transfer Function (phase)

![]()
Figure 12: Room 1 Point P2 Spectrograph
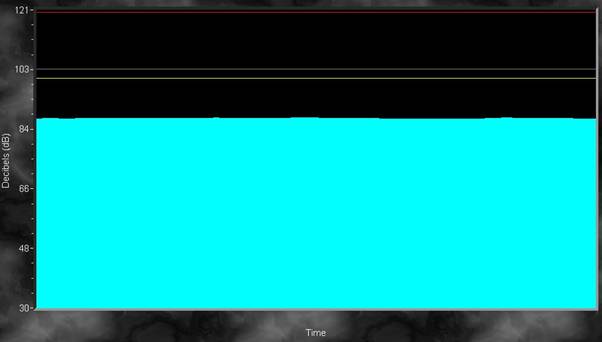
Figure 13: Room 1 point P2 SPL
Point P3
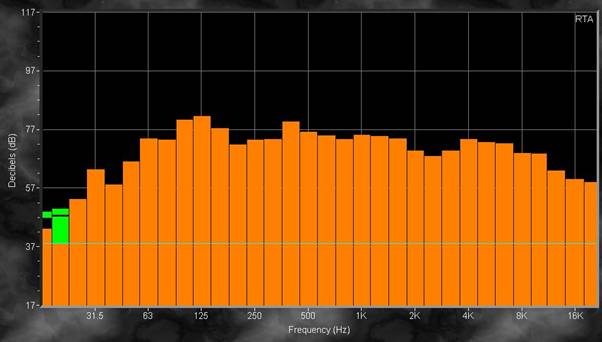
Figure 14: Room 1 Point P3 Frequency Spectrum
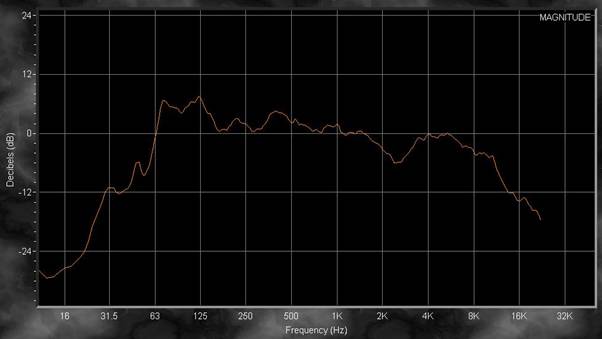
Figure 15: Room 1 Point P3 Frequency Transfer Function (deciBel)
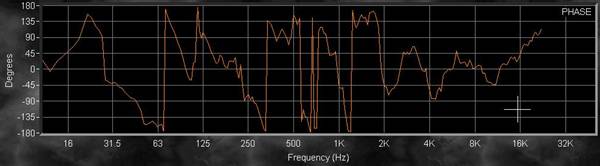
Figure 16: Room 1 Point P3 Frequency Transfer Function (phase)
![]()
Figure 17: Room 1 Point P3 Spectrograph
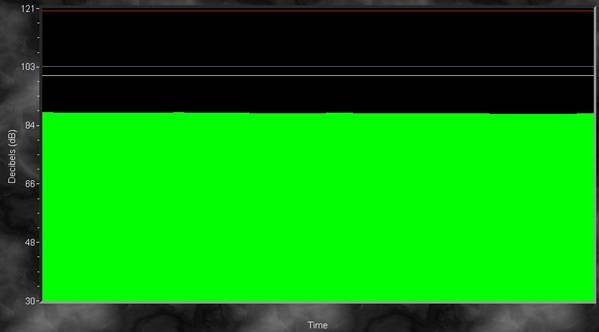
Figure 18: Room 1 Point P3 SPL
Point P4

Figure 19: Room 1 Point P4 Frequency Spectrum

Figure 20: Room 1 Point P4 Transfer Function (decibel)
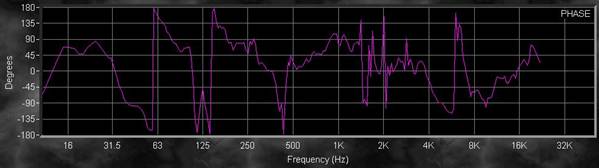
Figure 21: Room 1 Point P4 Transfer Function (phase)
![]()
Figure 22: Room 1 Point P4 Spectrograph
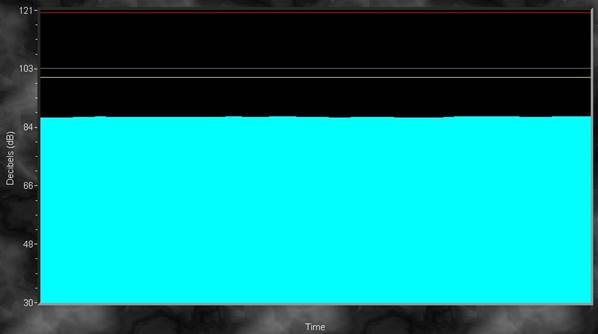
Figure 23: Room 1 Point P4 SPL
Point P5
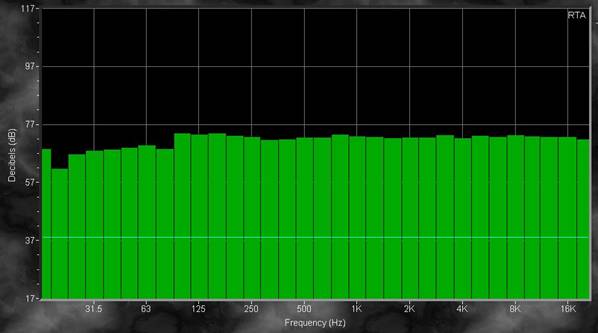
Figure 24: Room 1 Point P5 Frequency Spectrum

Figure 25: Room 1 Point P5 Frequency Transfer Function (decibel)
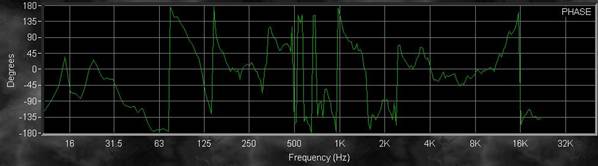
Figure 26: Room 1 Point P5 Frequency Transfer Function (phase)
![]()
Figure 27: Room 1 Point P5 Spectrograph
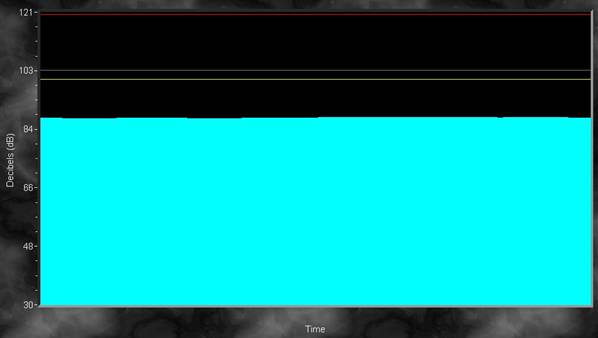
Figure 28: Room 1 Point P5 SPL
Room 2
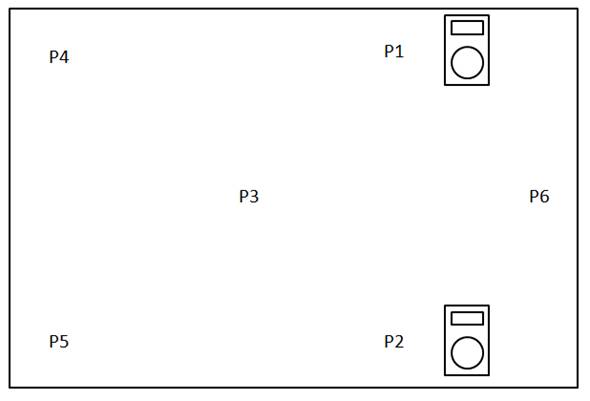
Figure 29: Room 2 Layout & Measurement Points
Point P1
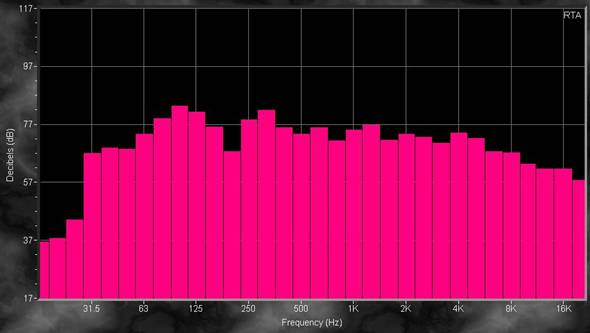
Figure 30: Room 2 Point P1 Frequency Spectrum
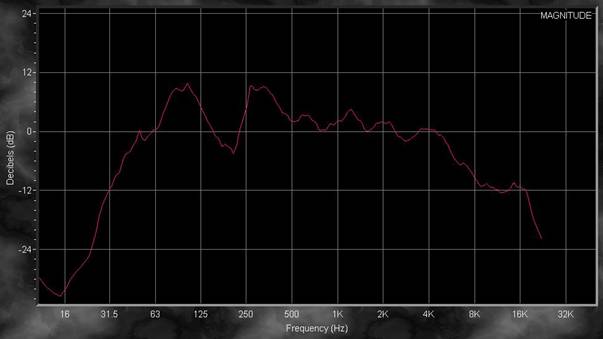
Figure 31: Room 2 Point P1 Frequency Transfer Function (decibel)
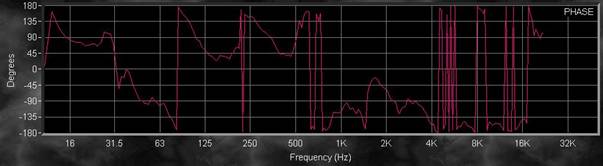
Figure 32: Room 2 Point P1 Frequency Transfer Function (phase)
![]()
Figure 33: Room 2 Point P1 Spectrograph
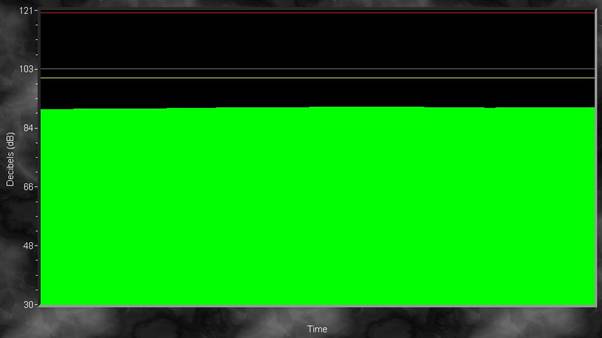
Figure 34: Room 2 Point P1 SPL
Point P2
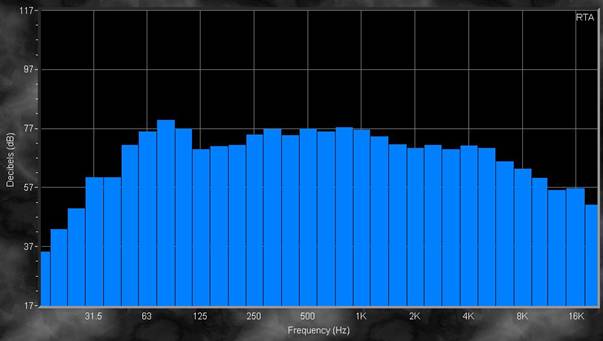
Figure 35: Room 2 Point P2 Frequency Spectrum
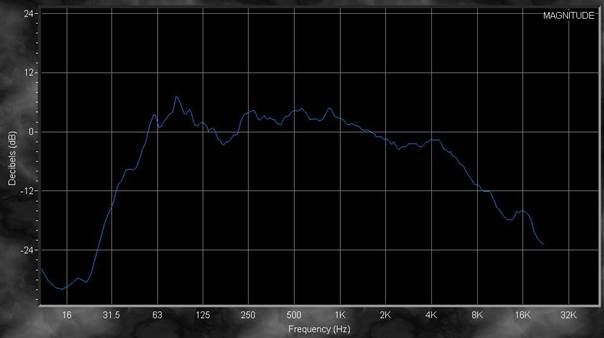
Figure 36: Room 2 Point P2 Frequency Transfer Function (decibel)
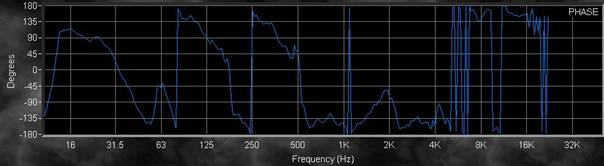
Figure 37: Room 2 Point P2 Frequency Transfer Function (phase)
![]()
Figure 38: Room 2 Point P2 Spectrograph
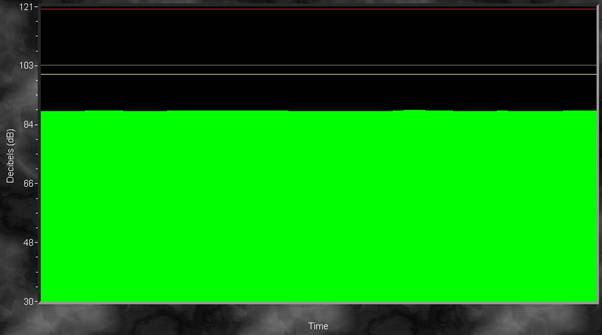
Figure 39: Room 2 Point P2 SPL
Point P3
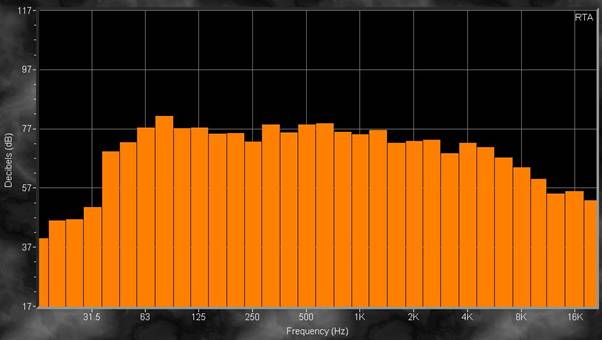
Figure 40: Room 2 Point P3 Frequency Spectrum
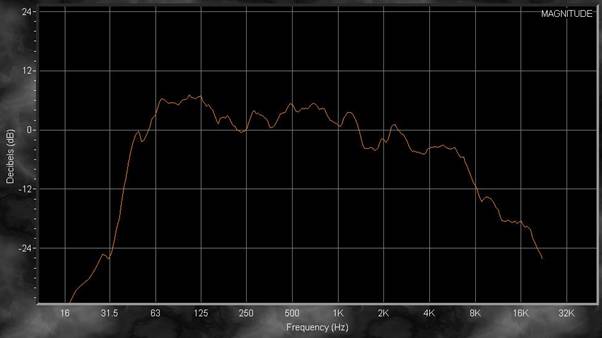
Figure 41: Room 2 Point P3 Frequency Transfer Function (decibel)
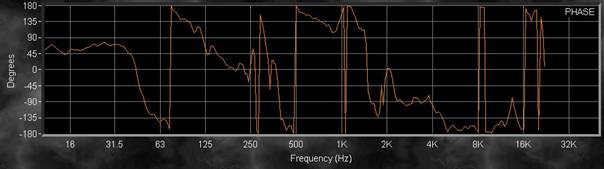
Figure 42: Room 2 Point P3 Frequency Transfer Function (phase)
![]()
Figure 43: Room 2 Point P3 Spectrograph
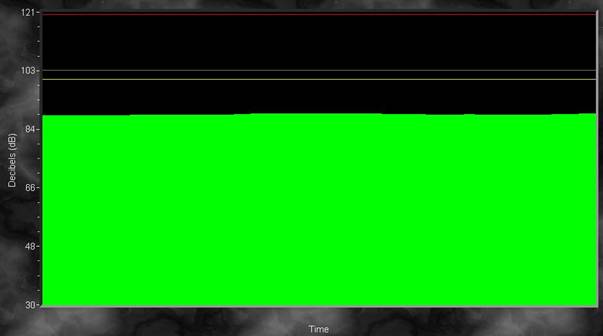
Figure 44: Room 2 Point P3 SPL
Point P4
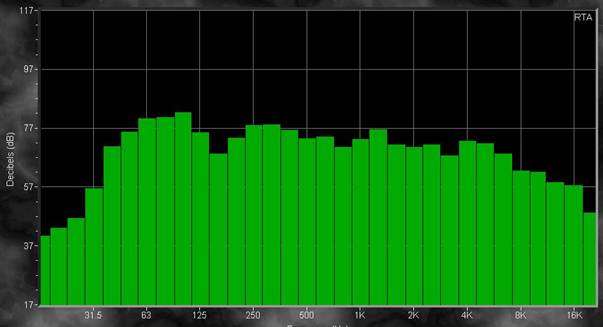
Figure 45: Room 2 Point P4 Frequency Spectrum
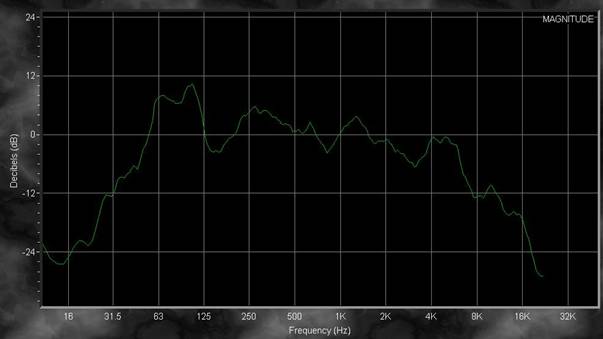
Figure 46: Room 2 Point P4 Frequency Transfer Function (decibel)
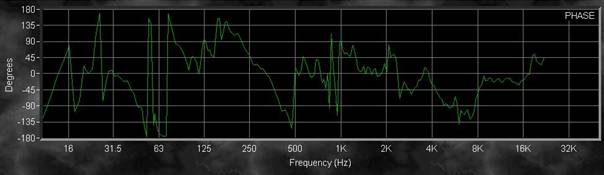
Figure 47: Room 2 Point P4 Frequency Transfer Function (phase)
![]()
Figure 48: Room 2 Point P4 Spectrograph
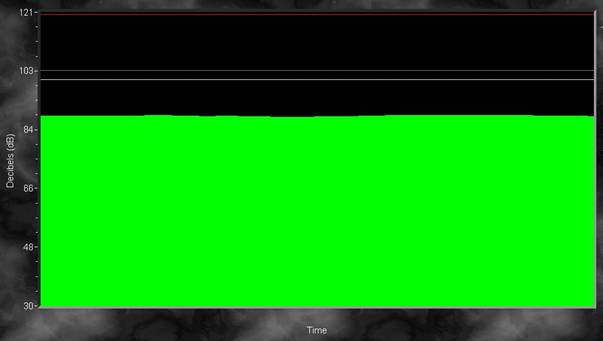
Figure 49: Room 2 Point P4 SPL
Point P5
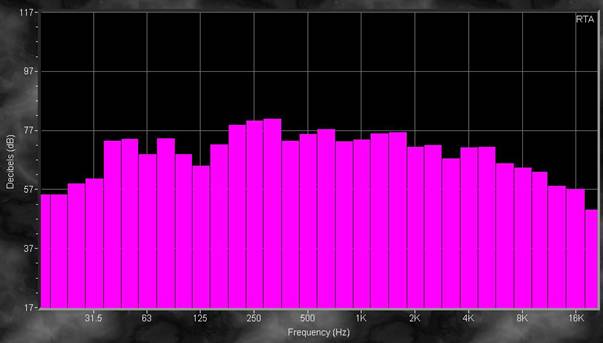
Figure 50: Room 2 Point P5 Frequency Spectrum
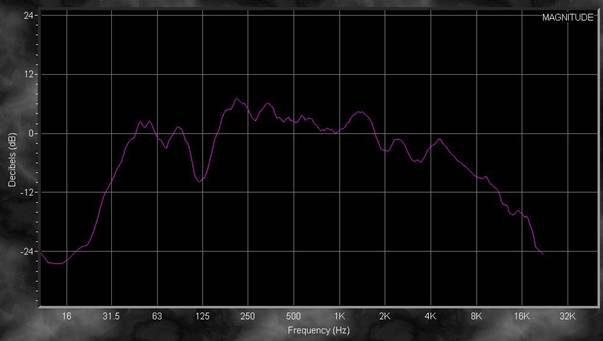
Figure 51: Room 2 Point P5 Frequency Transfer Function (decibel)
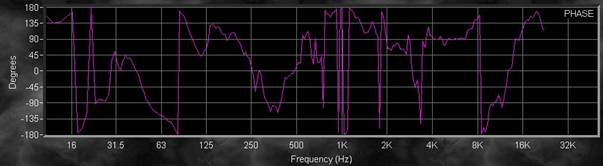
Figure 52: Room 2 Point P5 Frequency Transfer Function (phase)
![]()
Figure 53: Room 2 Point P5 Spectrograph
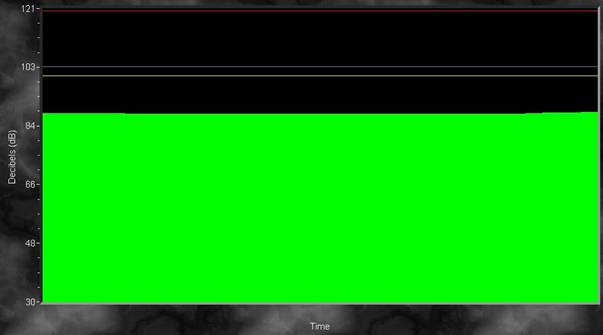
Figure 54: Room 2 Point P5 SPL
Point P6
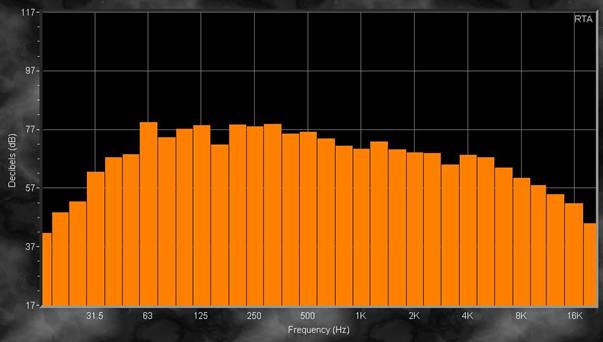
Figure 55: Room 2 Point P6 Frequency Spectrum
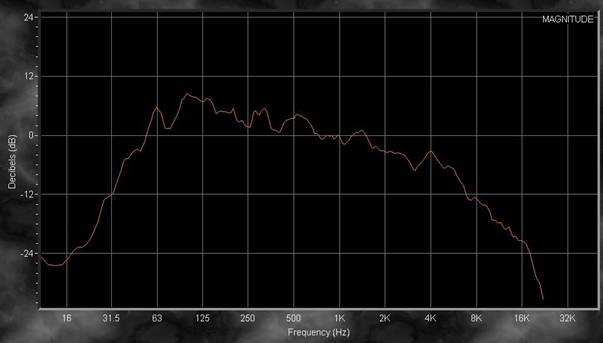
Figure 56: Room 2 Point P6 Frequency Transfer Function (decibel)
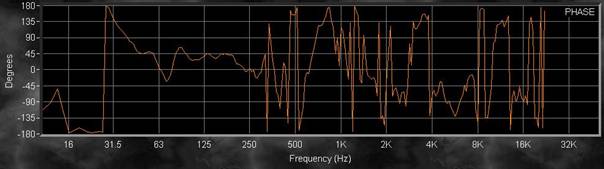
Figure 57: Room 2 Point P6 Frequency Transfer Function (phase)
![]()
Figure 57: Room 2 Point P6 Spectrograph
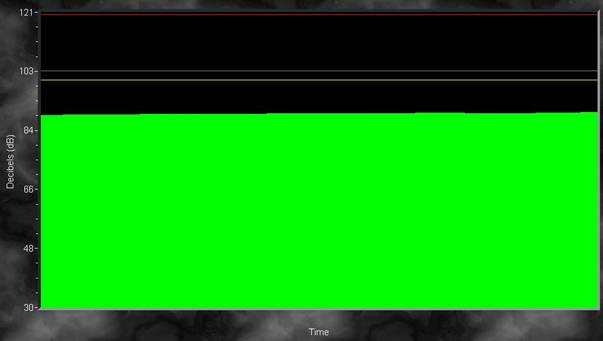
Figure 58: Room 2 Point P6 SPL
Room 3

Figure 59: Room 3 Layout & Measurement Points
Point P1
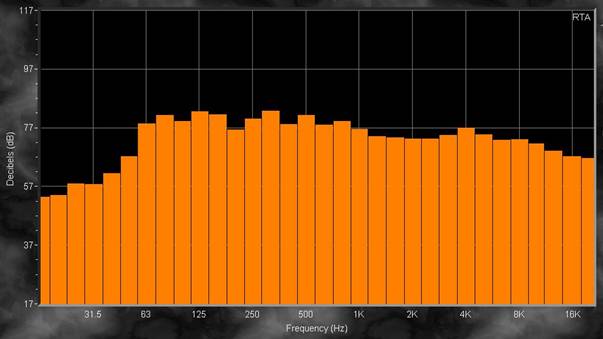
Figure 60: Room 3 Point P1 Frequency Spectrum
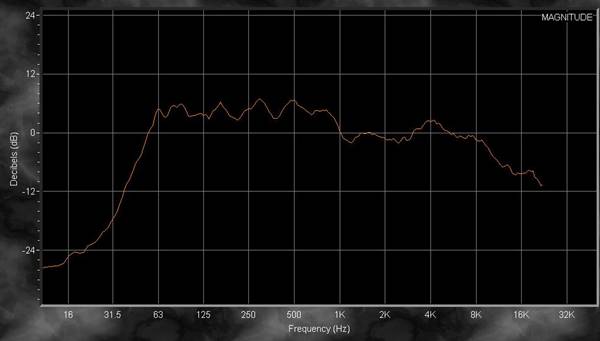
Figure 61: Room 3 Point P1 Frequency Transfer Function (decibel)
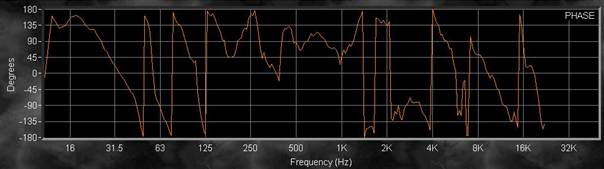
Figure 62: Room 1 Point P1 Frequency Transfer Function (phase)

![]()
Figure 63: Room 3 Point P1 Spectrograph
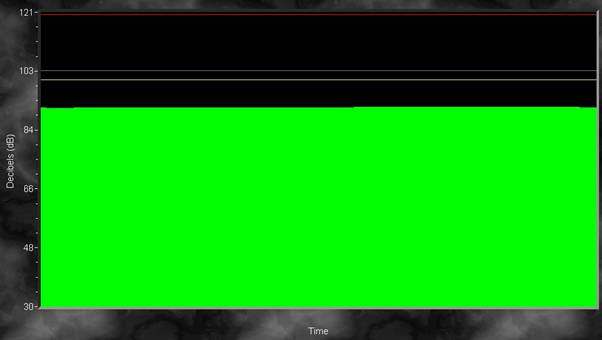
Figure 64: Room 3 Point P1 SPL
Point P2
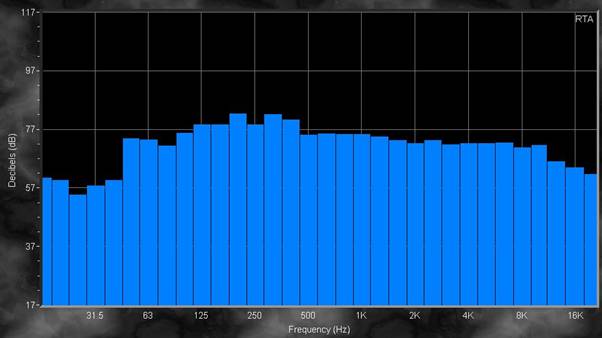
Figure 65: Room 3 Point P2 Frequency Spectrum
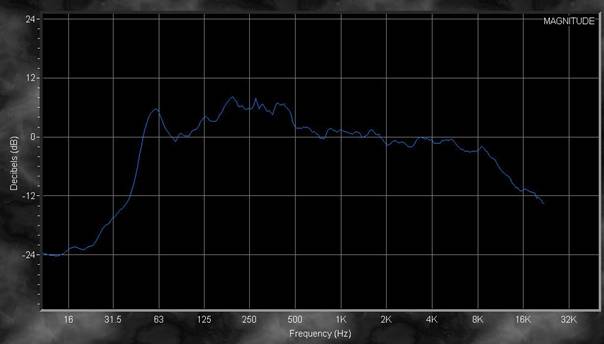
Figure 66: Room 3 Point P2 Frequency Transfer Function (decibel)
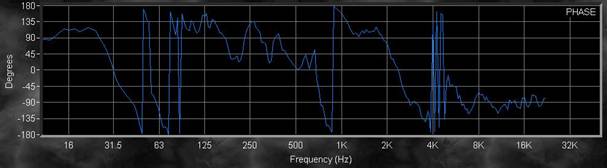
Figure 67: Room 3 Point P2 Frequency Transfer Function (phase)
![]()
Figure 68: Room 3 Point P2 Spectrograph
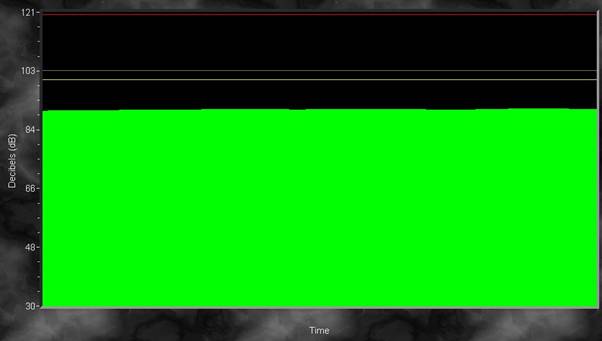
Figure 69: Room 3 Point P2 SPL
Point P3
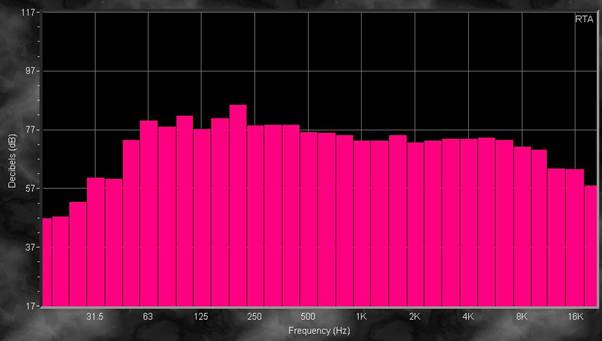
Figure 70: Room 3 Point P3 Frequency Spectrum
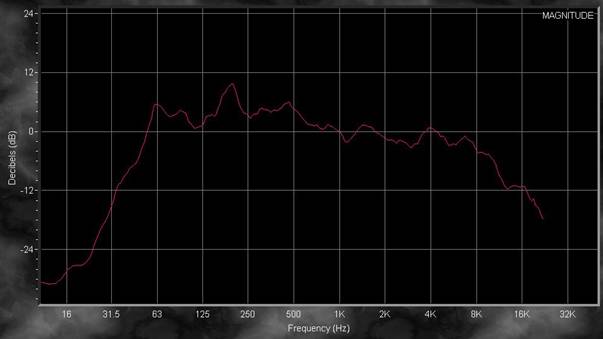
Figure 71: Room 3 Point P3 Frequency Transfer Function (decibel)
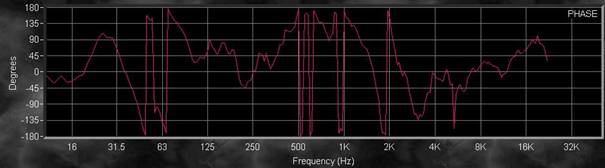
Figure 72: Room 3 Point P3 Frequency Transfer Function (phase)
![]()
Figure 73: Room 3 Point P3 Spectrograph

Figure 74: Room 3 Point P3 SPL
Point P4
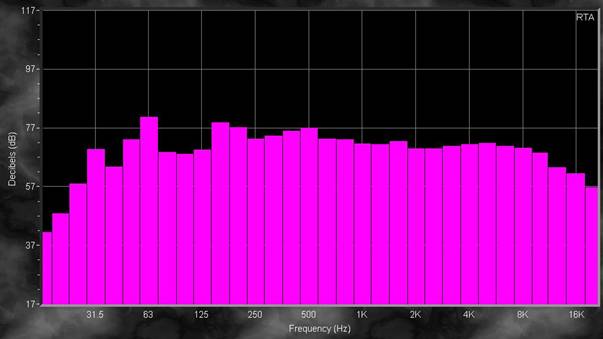
Figure 75: Room 3 Point P4 Frequency Spectrum
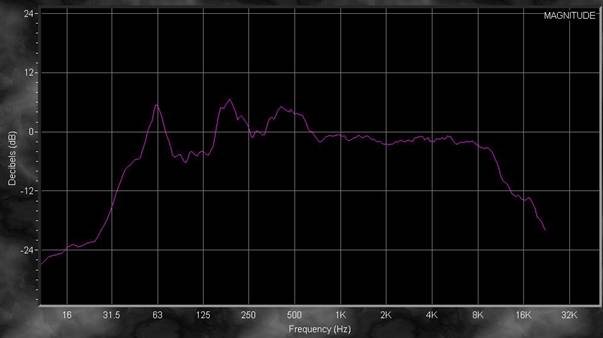
Figure 76: Room 3 Point P4 Frequency Transfer Function (decibel)
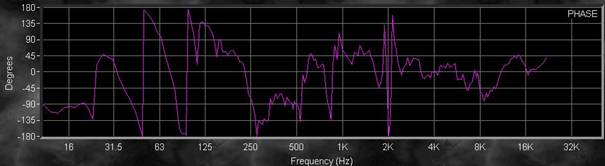
Figure 77: Room 3 Point P4 Frequency Transfer Function (phase)
![]()
Figure 78: Room 3 Point P4 Spectrograph
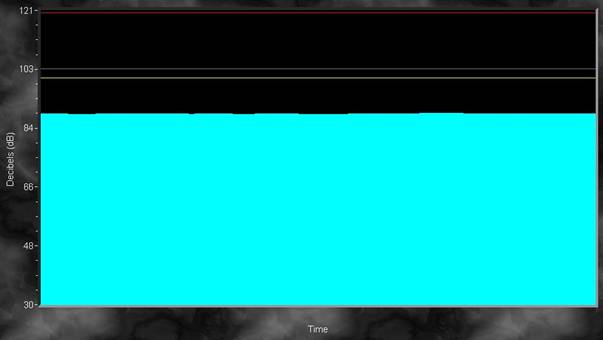
Figure 79: Room 3 Point P4 SPL
Point P5

Figure 80: Room 3 Point P5 Frequency Spectrum
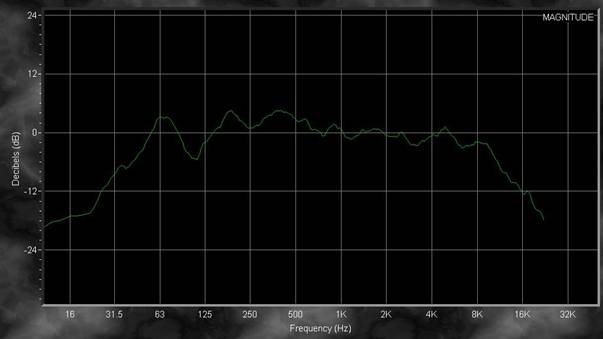
Figure 81: Room 3 Point P5 Frequency Transfer Function (decibel)
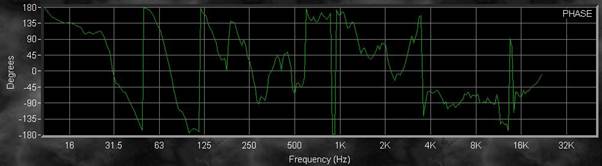
Figure 82: Room 3 Point P5 Frequency Transfer Function (phase)

![]()
Figure 82: Room 3 Point P5 Spectrograph
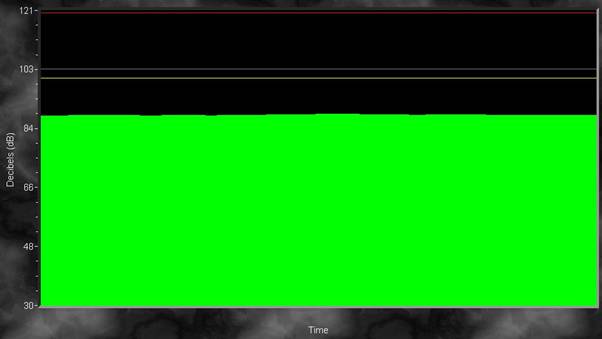
Figure 83: Room 3 Point P5 SPL
Room 4

Figure 84: Room 4 Layout & Measurement Points
Point P1
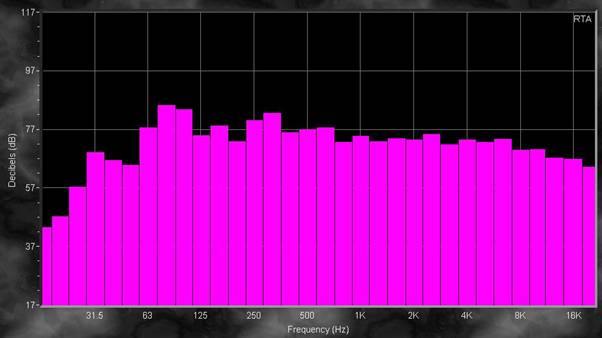
Figure 85: Room 4 Point P1 Frequency Spectrum
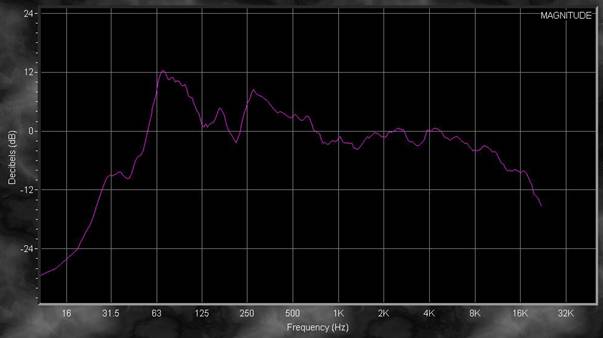
Figure 86: Room 4 Point P1 Frequency Transfer Function (decibel)
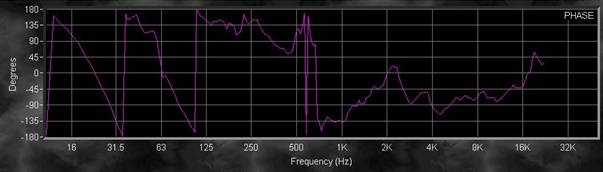
Figure 87: Room 4 Point P1 Frequency Transfer Function (phase)

![]()
Figure 88: Room 4 Point P1 Spectrograph

Figure 89: Room 4 Point P1 SPL
Point P2
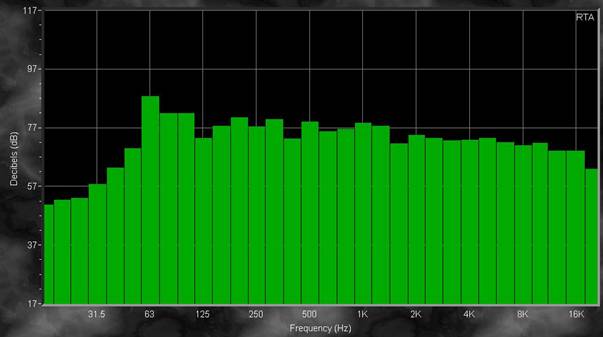
Figure 90: Room 4 Point P2 Frequency Spectrum

Figure 91: Room 4 Point P2 Frequency Transfer Function (decibel)
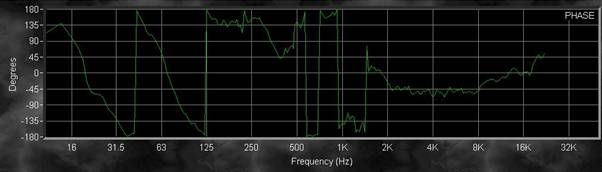
Figure 92: Room 4 Point P2 Frequency Transfer Function (phase)
![]()
Figure 93: Room 4 Point P2 Spectrograph
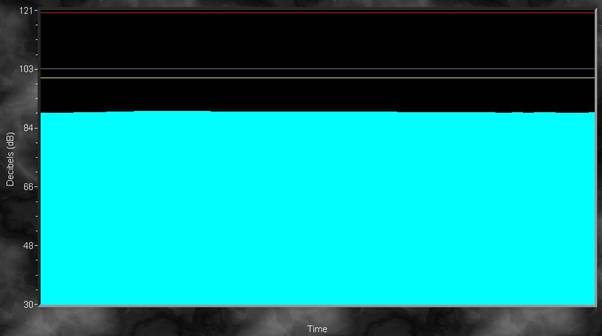
Figure 94: Room 4 Point P2 SPL
Point P3
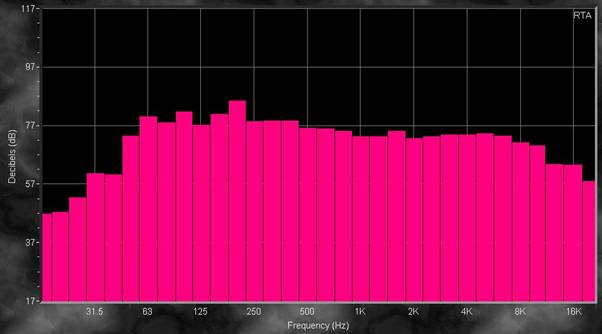
Figure 95: Room 4 Point P3 Frequency Spectrum
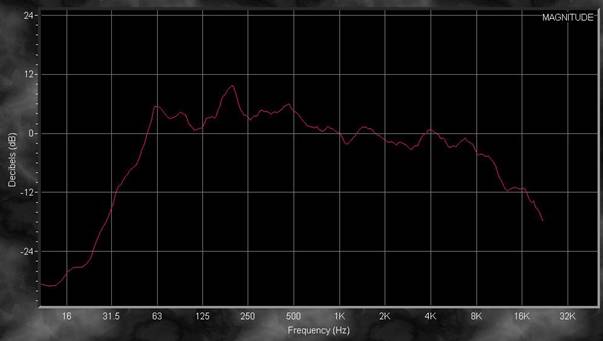
Figure 96: Room 4 Point P3 Frequency Transfer Function (decibel)
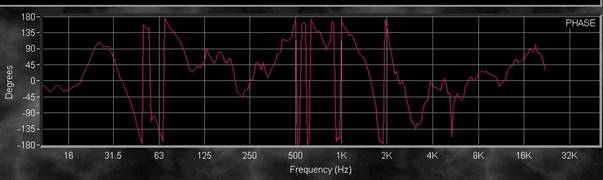
Figure 97: Room 4 Point P3 Frequency Transfer Function (phase)
![]()
Figure 98: Room 4 Point P3 Spectrograph
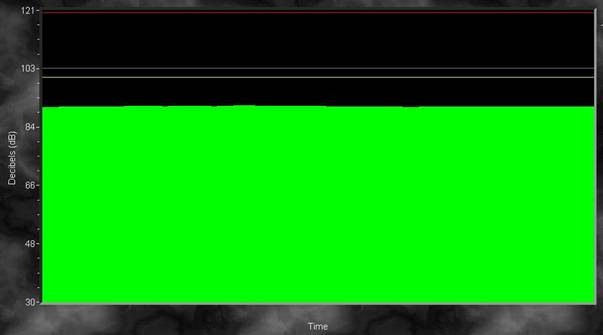
Figure 99: Room 4 Point P3 SPL
Point P4
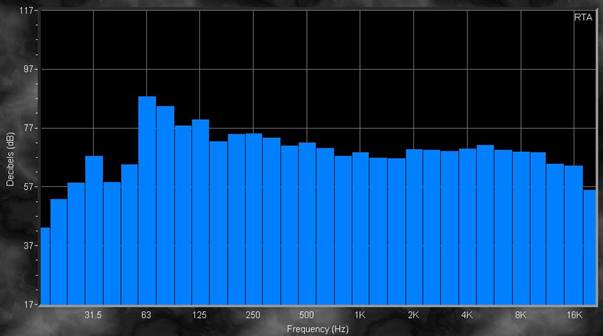
Figure 100: Room 4 Point P4 Frequency Spectrum
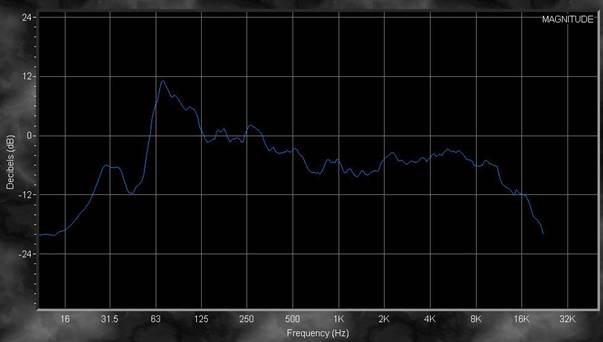
Figure 101: Room 4 Point P4 Frequency Transfer Function (decibel)
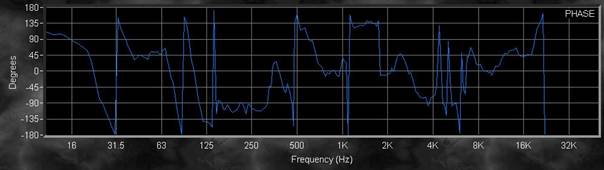
Figure 102: Room 4 Point P4 Frequency Transfer Function (phase)
![]()
Figure 103: Room 4 Point P4 Spectrograph
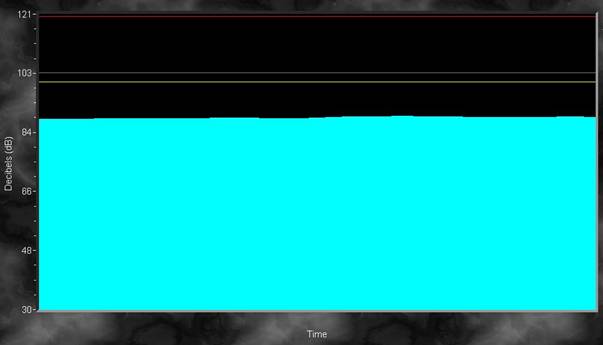
Figure 104: Room 4 Point P4 SPL
Point P5
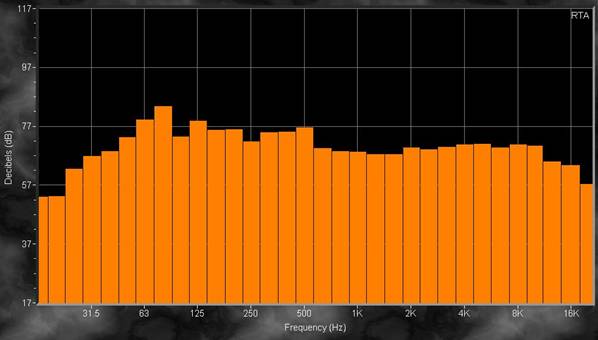
Figure 105: Room 4 Point P5 Frequency Spectrum
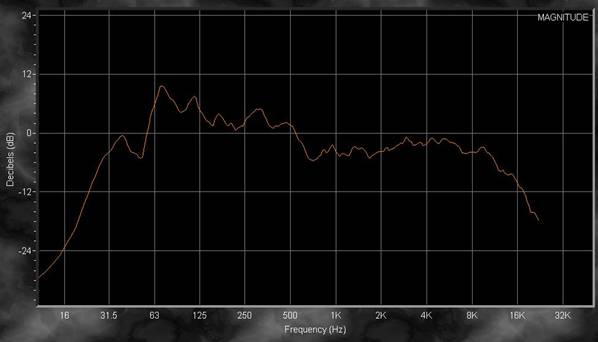
Figure 106: Room 4 Point P5 Frequency Transfer Function (decibel)
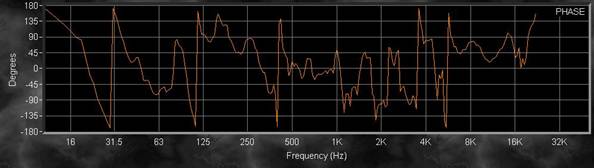
Figure 107: Room 4 Point P5 Frequency Transfer Function (phase)
![]()
Figure 108: Room 4 Point P5 Spectrograph
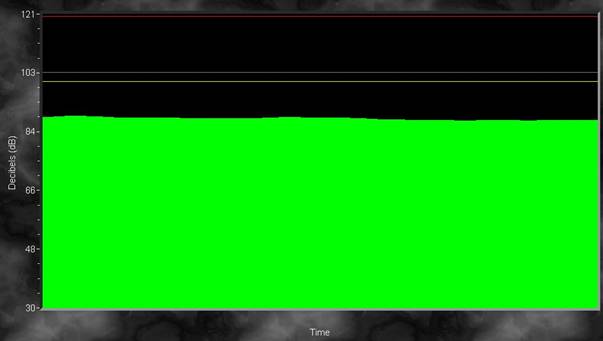
Figure 109: Room 4 Point P5 SPL